 TodaysBru
5 Classic Help Desk Metrics—and How an AI Helpdesk Changes Them
How five familiar help desk metrics evolve when an AI helpdesk resolves requests, what still matters for human support, and which reports TodaysBru provides.
· 5 min read · The TodaysBru teamAn AI helpdesk should solve an employee’s problem in the conversation, using your knowledge base, previous fixes, and employee context. Whether the employee uses web chat or Slack, that should cover a broad range of support needs, from device troubleshooting to company-specific software questions.
When work does need a person, the team should know why it reached them and have enough information to act. Traditional ticket metrics still help manage that work. The new report also needs to show what AI completed before a ticket was necessary.
| Traditional measure | Adapted measure | What to keep |
|---|---|---|
| First response time | A clear resolution path and an actionable handoff when a person is needed | Useful-answer speed and human response time for escalations |
| Resolution time | Time until the employee’s problem is solved, across AI and human paths | Ticket resolution time for work handled by the team |
| First contact resolution | Share of support requests solved in the conversation without a human | First contact resolution on the human support path |
| Ticket volume and backlog | Total support demand, ticket creation rate, and remaining backlog | Ticket trends, aging, and workload |
| SLA compliance | Meeting service commitments across automated help and human exceptions | Priority-based ticket SLAs and open breaches |
Measure resolution and the quality of what reaches the team
Start with work completed in the conversation. For an AI helpdesk aiming to answer more than 80% of questions, track answer coverage alongside successful resolution. An answer shows that AI responded; a confirmed resolution shows that the employee got what they needed. Count one employee need as one support request, even when it spans several messages or produces a ticket. Keep human handoffs and unconfirmed outcomes visible.
Make the remaining work understandable. Review why requests need a person: an approval, physical repair, service incident, or missing knowledge or capability. Group those reasons by request type and destination team. That helps you distinguish work that needs human involvement from recurring questions AI could handle with better knowledge or integrations. Intercom’s AI reporting also distinguishes answers, resolutions, and escalations.
Check whether handoffs are ready for action. They should carry the employee’s goal, impact, relevant device or application, attempted fixes, escalation reason, and next owner. “VPN still fails on this device after these documented checks” gives a technician a starting point. Review a sample and record how often the team can act without repeating the opening questions. This handoff-quality measure complements response time; track useful-answer speed and human pickup time separately.
Keep the operational checks. Resolution time, aging backlog, workload, and ticket SLAs still matter. Show AI-only and human-assisted paths separately: as AI handles more routine work, the tickets reaching technicians may become harder on average. Check repeat issues and employee feedback alongside speed. A good report tells you both how much support was completed and whether the remaining work is being handled well.
Use those findings to improve the knowledge base from resolved work and the context available in the conversation. Each recurring escalation should suggest a concrete next improvement.
For a shorter morning routine, use the daily IT helpdesk report guide to review five numbers and decide what needs attention today.
Which reports are available in TodaysBru?
Agents, managers, and admins can open Reports in their workspace and choose a time range. These reports help you understand the mix of tickets reaching the team, who holds the work, and where it is getting stuck.
| Report or measure | Available today | What it helps you understand |
|---|---|---|
| Ticket demand and mix | Created/resolved trends; volume by category, priority, and team | Which types of tickets are reaching the team and how demand changes |
| Backlog and aging | Backlog trend and current open-ticket age bands, including older work outside the selected time range | What remains open and which work needs attention |
| SLA compliance | By priority and team, using recorded SLA status at resolution; tickets without that snapshot are excluded | Where resolved tickets met or missed their service commitments |
| Agent workload and resolution | Current open assignments, resolved counts, and average elapsed resolution hours | Who holds the work and how long their resolved tickets took |
| Ticket-level investigation | Drill-downs from chart bars and supported chart titles; ticket links and CSV exports | The individual cases behind a category, team, aging, workload, or SLA result |
| Conversation resolution and handoff quality | Additional collection or manual review needed; not a built-in Reports measure | What AI finishes, why requests need a person, and whether the handoff is ready for action |
| Useful-help and human-response timing | Additional collection needed; not a built-in Reports measure | How quickly an employee receives useful help or a human picks up an escalation |
| Resolution percentiles and quality | Additional collection or review needed for medians/percentiles, human first contact resolution, repeat issues, and employee feedback | Slow cases, repeat problems, and whether employees received a successful fix |
Click a chart bar to inspect the tickets behind its number, or click a supported chart title to open the whole group. Each ticket row links to its details. Export CSV downloads either the page’s summaries or the ticket list in an opened report. See the Reports help guide for the workflow.
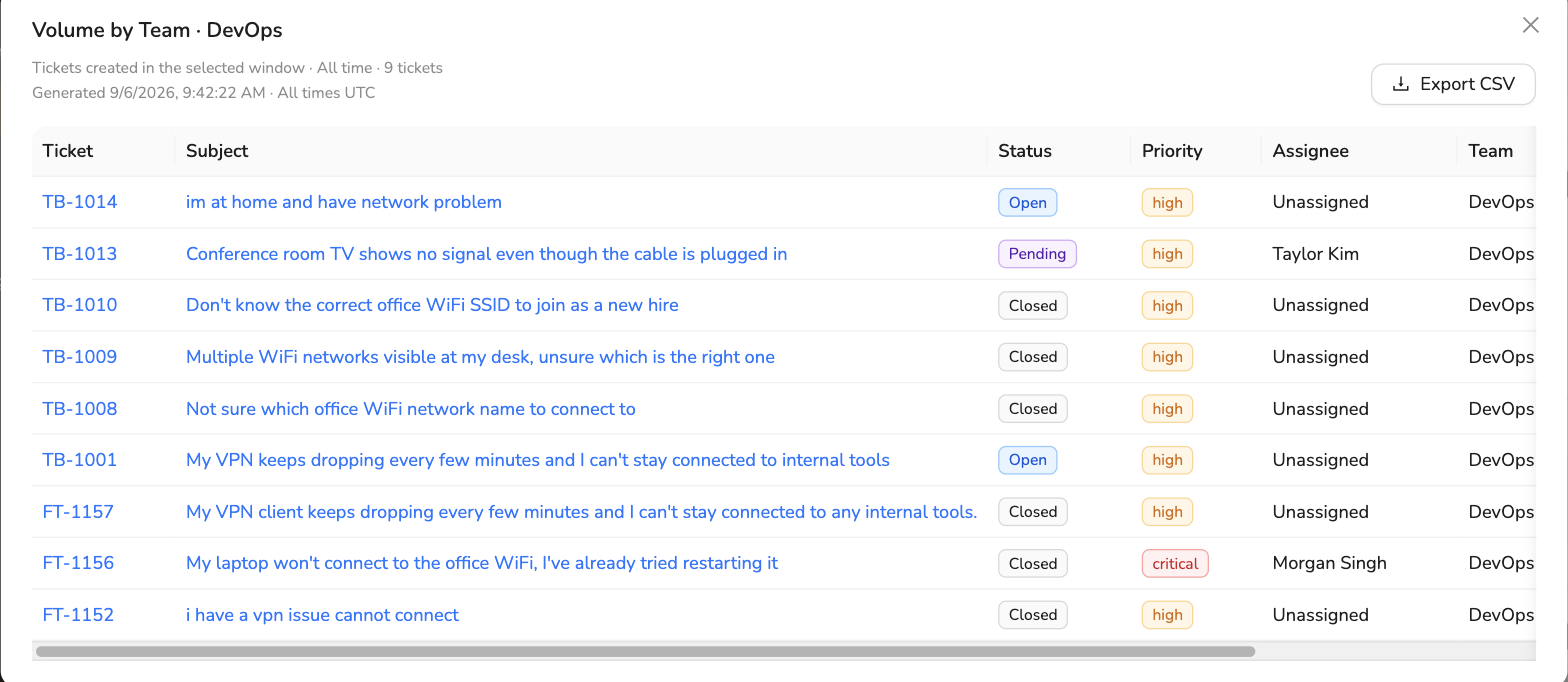
The ticket reports above are available today; the conversation measures describe what to add through collection or review. Start with those you can measure consistently, then use the results to choose the next knowledge or workflow improvement.
Download the monthly report template (CSV for Excel) and fill in your results beside the metric definitions and fictional examples. The worksheet covers AI outcomes and team workload; blank results mean “not measured.”